Data | Domains
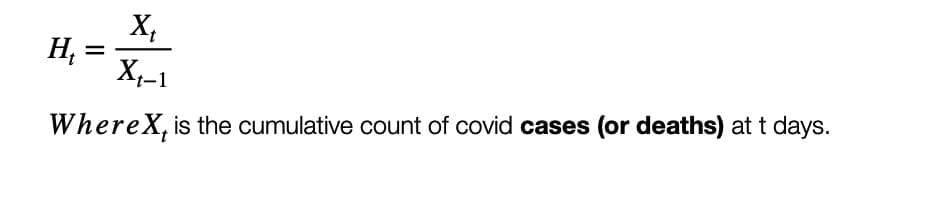
Multi-threshold Neuron Model 
godatadriven 08 Mar, 2018


We know now that we have to live with Covid-19. Just like we have learnt to live with the flu virus very year. But the bigger question in everybody’s minds, governments, companies, organisations, communities and individuals world wide is when will it taper off to manageable levels.
Is there a covid 19 prediction model that can predict in how many days (months) it will end? It appears there is a model that does it. This model has been proposed by Nobel laureate Prof Michael Levitt who used this on Hubei data and later on data from other countries with great accuracy. The Levitt Model is robust, simple and has fidelity inspite of population size, testing capabilities, missing data, under reporting, geographic region and also around ‘what constitutes a Covid-19 death’.
We just used it on Covid-19 data reported by Telangana State (India) (Source : https://en.wikipedia.org/wiki/COVID-19_pandemic_in_Telangana) to see when it will end in my state. We applied this to covid data of Telangana from 14th March 2020 to 5th July 2020. We then did a Best Line Regression fitment on the data. Then we extrapolated this best fit curve to see when the virus will taper off.
From literature they used linear regression to get best fit. We have enhanced this to also fit a power law regression which is a better estimator, as power law is the norm in nature as opposed to linear models.
We also report the R2 scores of the regression.
First let us define the Levitt Model as it was proposed.
We got the cumulative covid-19 cases and deaths as reported for our creating the model.
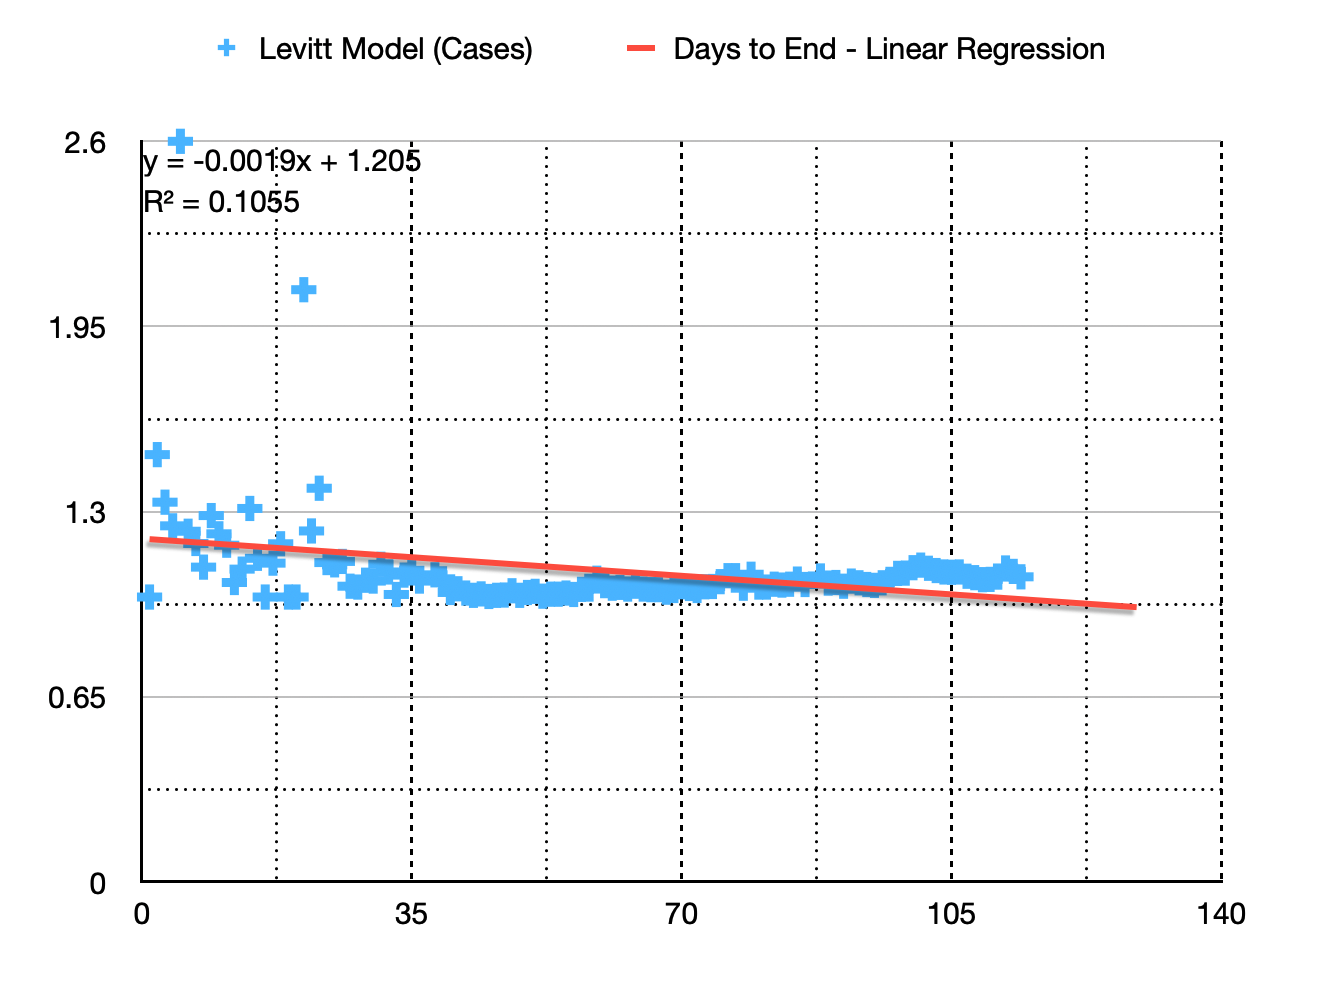
As you can see the Best fit curve by linear regression is a straight line defined by the equation :
This gives a Days to End of Pandemic (from first death): 107.40 ~ 108 days which is about 14th July 2020 (about now)
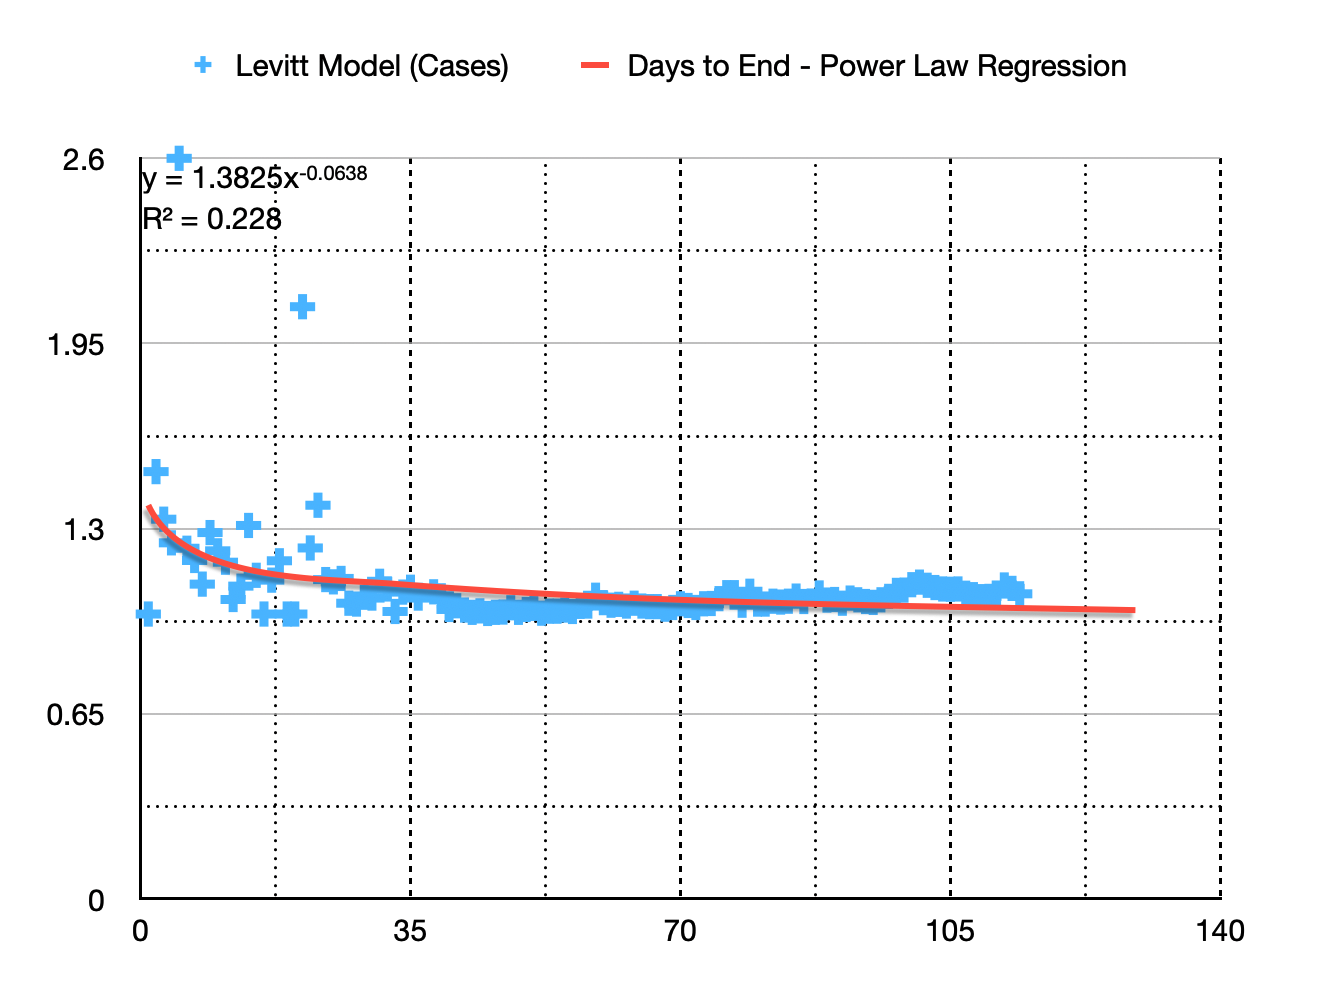 As you can see the Best fit curve by power law regression is a power law function defined by the equation :
This gives a Days to End of Pandemic (from first death): 157.8 ~ 158 days which is around 1st week of September (3rd or 4th September) around 44 days from 20th July 2020!!!!!
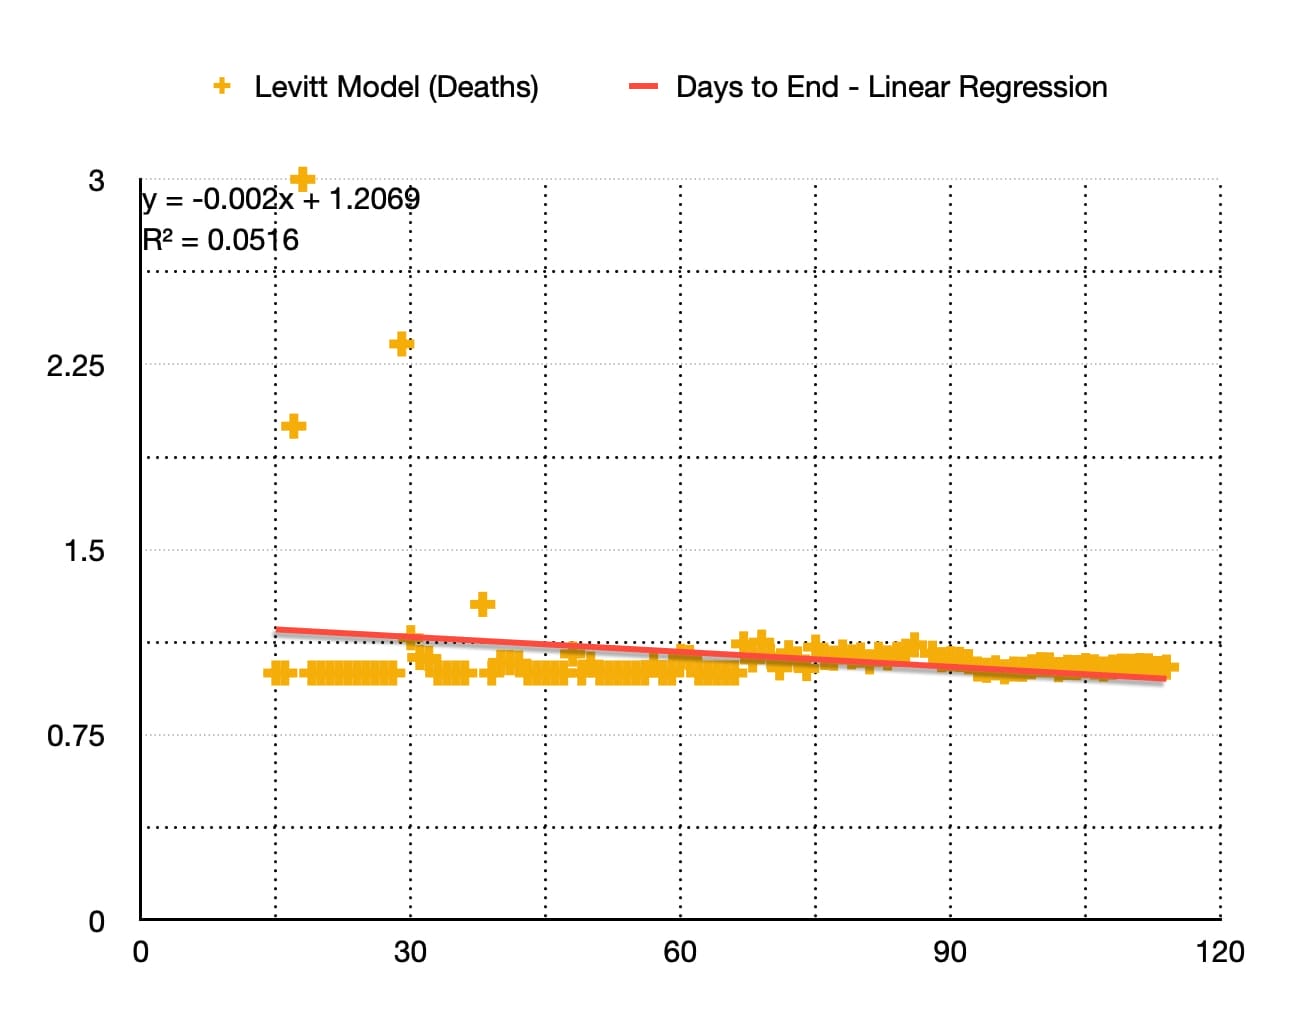 As you can see the Best fit curve by linear regression is a straight line defined by the equation :
This gives a Days to End of Pandemic (from first death) : 102.95 ~ 103 days which is about 9th July 2020
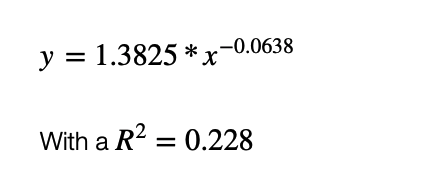
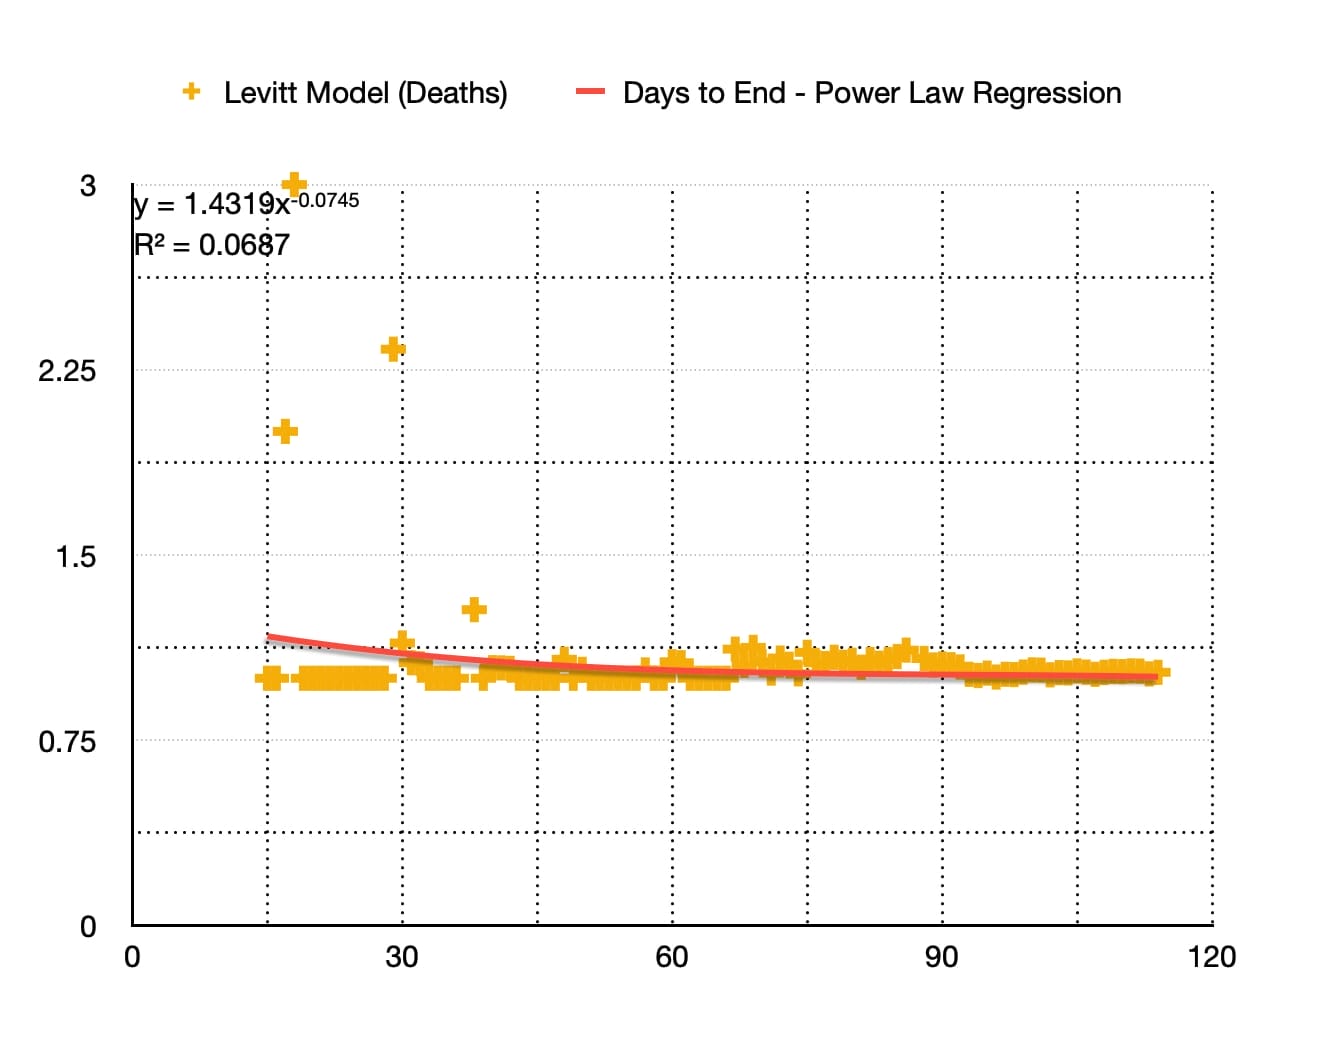 As you can see the Best fit curve by power law regression is a power law function defined by the equation :
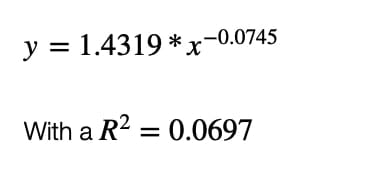
This gives a Days to End of Pandemic (from first death): 122 days which is around 28th of July 2020
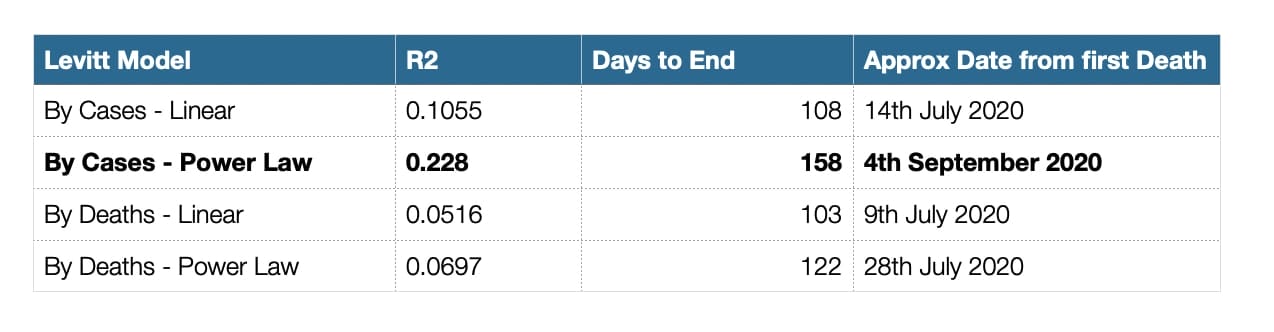 From this model metrics we can derive the following:
You can reach out to me at sai.panyam@idealantis.com OR sai.panyam@gmail.com for any custom data analysis, modelling and/or AI/ML projects. We are on the lookout for interesting datasets on which we can get interesting and useful insights.
Python code to determine the Days to End of Pandemic
By Cases
def TS_covid_levitt_linear_model(x):
return -0.0019 * x + 1.205
def TS_covid_end_day_linear(y):
return (1.205 – y)/0.0019# Extrapolate for Ht = 1.001
ts_end_days_linear = TS_covid_end_day_linear(1.001)print (ts_end_days_linear)
def TS_covid_levitt_power_model(x):
return 1.3825 * np.power(x, -0.0638)
def TS_covid_end_day_power(y):
return np.power((1.3825/y), 1.0/0.0638)
# Extrapolate for Ht = 1.001
ts_end_days_power = TS_covid_end_day_power(1.001)print (ts_end_days_power)
By Deaths
def TS_covid_levitt_linear_model_by_deaths(x):
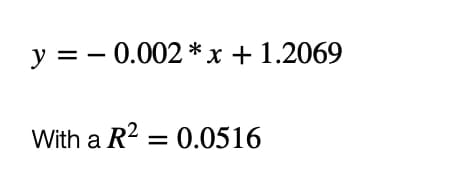
return -0.002 * x + 1.2069
def TS_covid_end_day_linear_by_deaths(y):
return (1.2069 – y)/0.002# Extrapolate for end of pandemic
ts_end_days_linear_by_deaths = TS_covid_end_day_linear_by_deaths(1.001)
print (ts_end_days_linear_by_deaths)def TS_covid_levitt_power_model_by_deaths(x):
return 1.4319 * np.power(x, -0.0745)
def TS_covid_end_day_power_by_deaths(y):
return np.power((1.4319/y), 1.0/0.0745)# Extrapolate for end of pandemic
ts_end_days_power_by_deaths = TS_covid_end_day_power_by_deaths(1.001)
print (ts_end_days_power_by_deaths)